Vincy
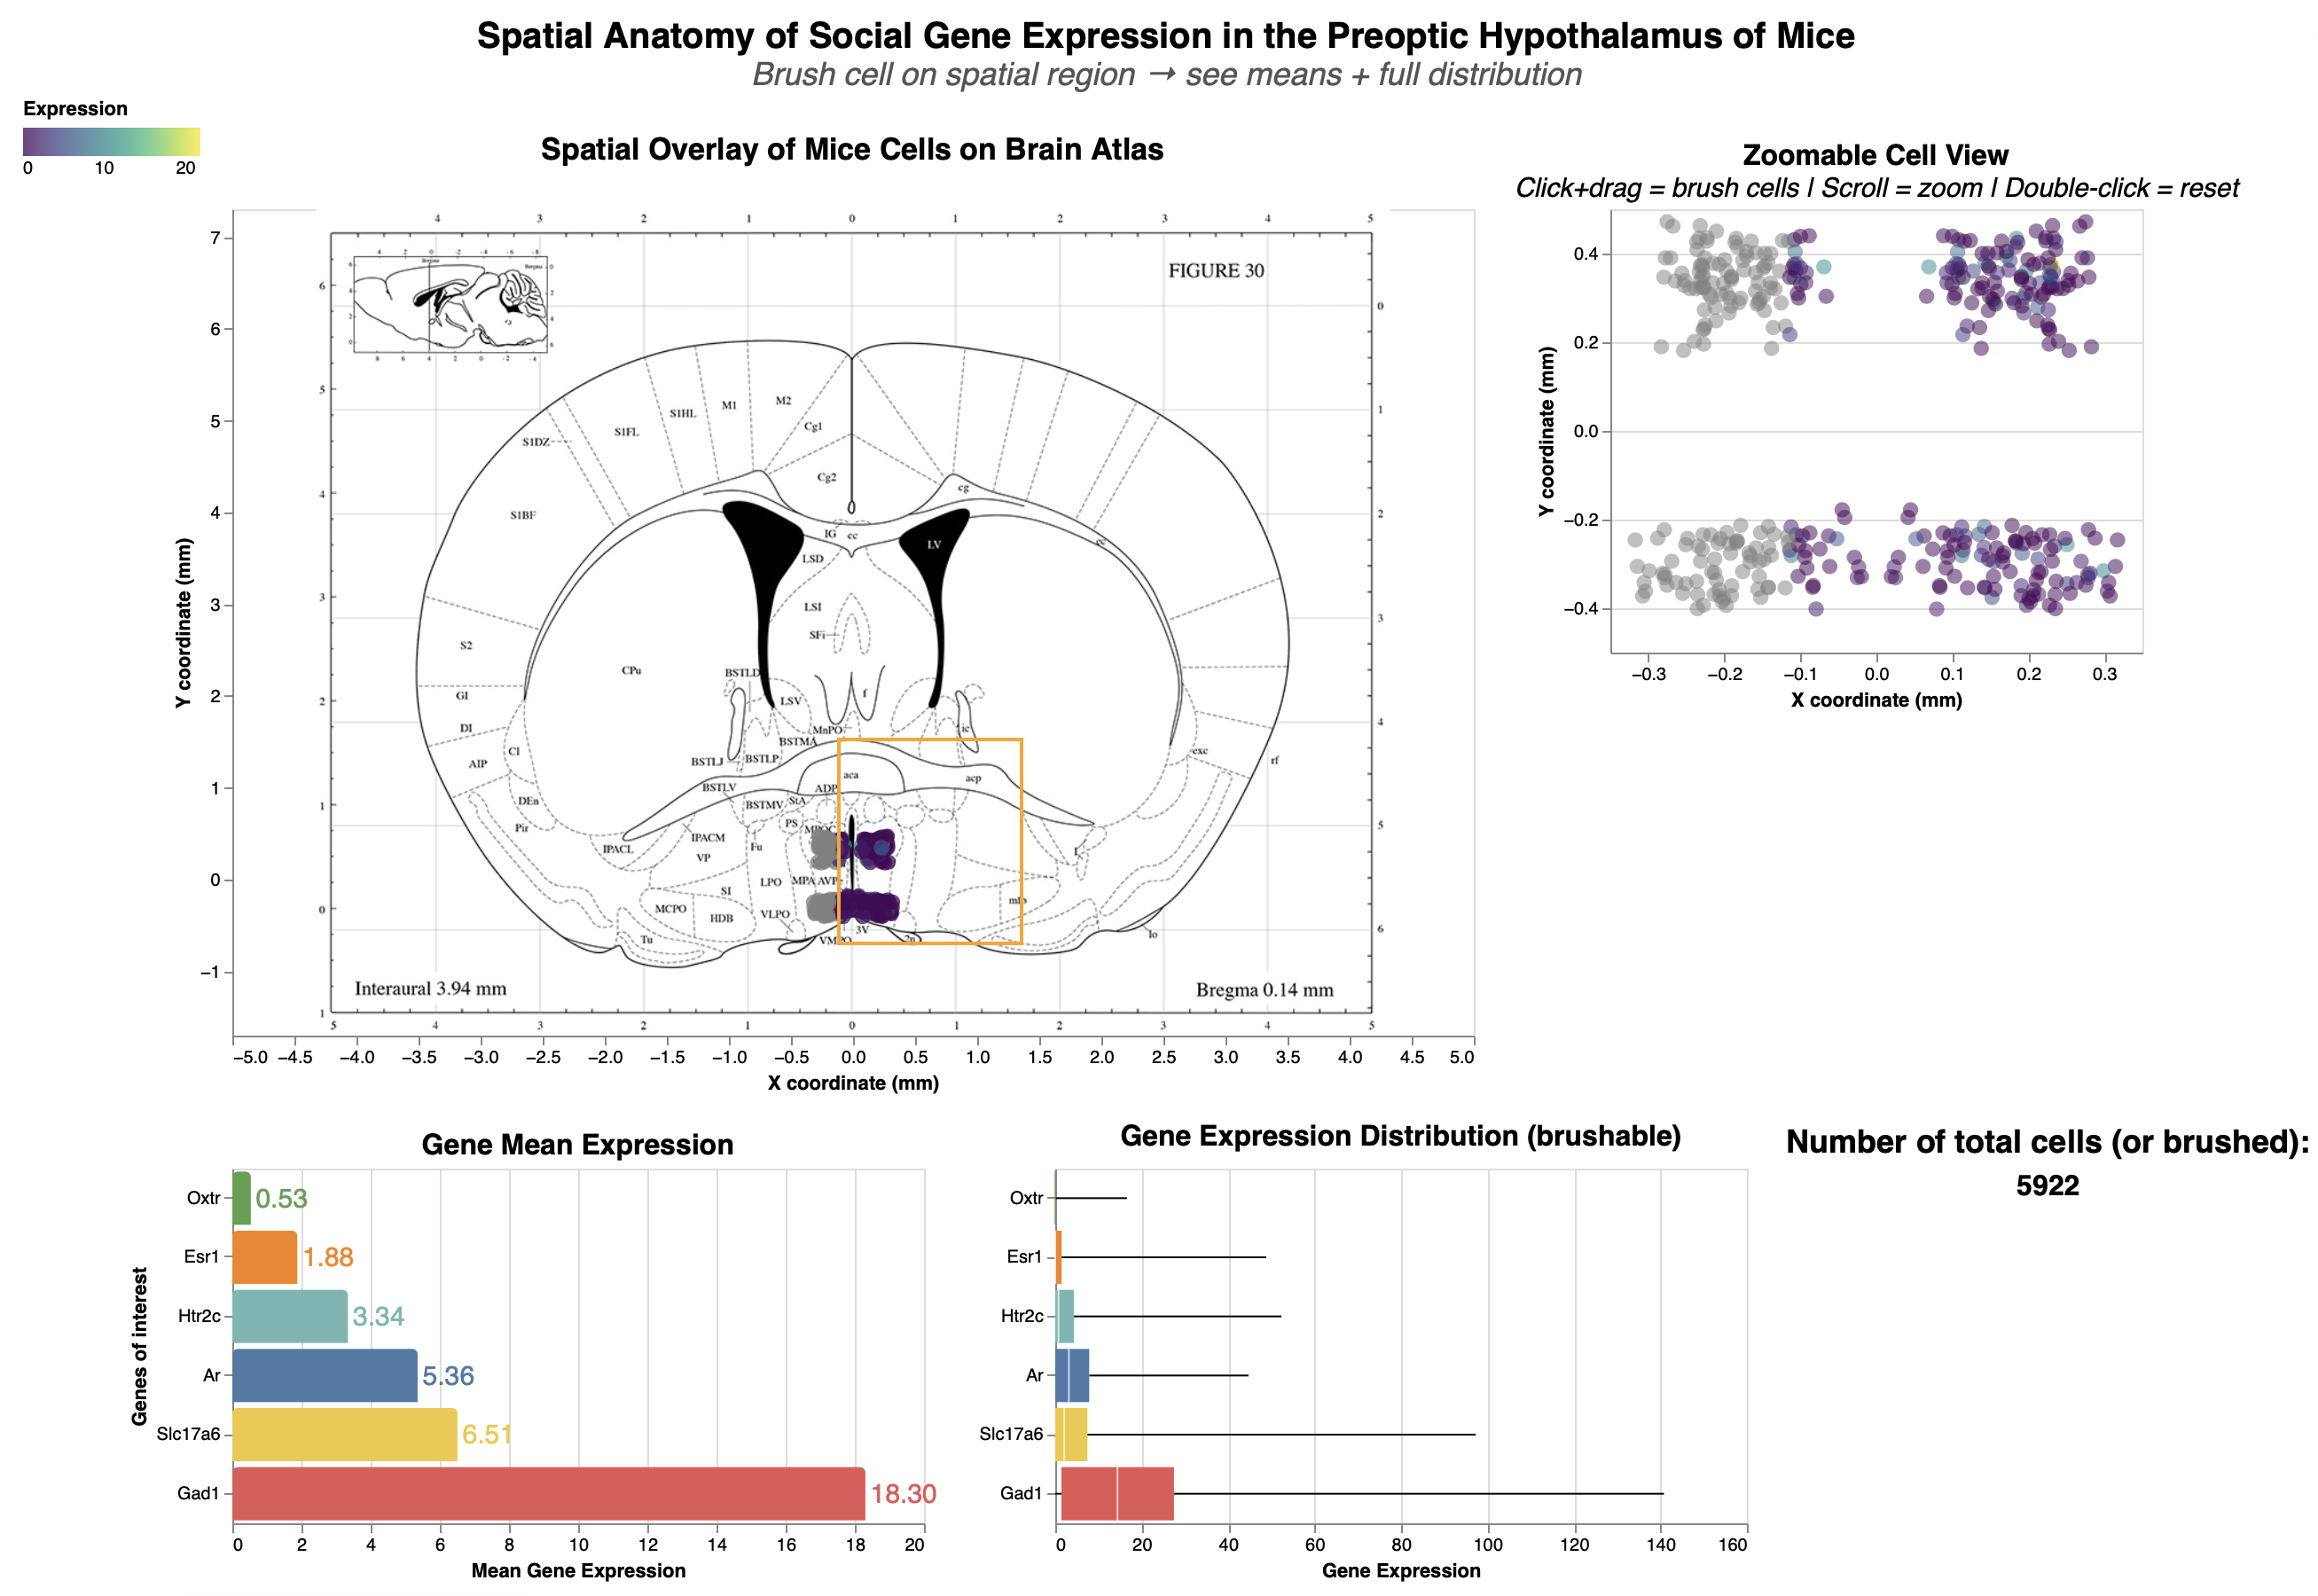
01 – Spatial Mapping to Brain Atlas
Maps cells to a mouse brain atlas, revealing origins in ventral, bottom brain regions like Medial Preoptic Necleus (MPOC), medial part of Medial Preoptic (MPOM), and the Medial Preoptic Area (MPA), providing nuanced anatomical insights within the POA across behaviors and key social genes.
Additional Notes
This novel and perhaps unprecedented Altair-based genetic-level brain mapping enhances understanding of spatial organization.
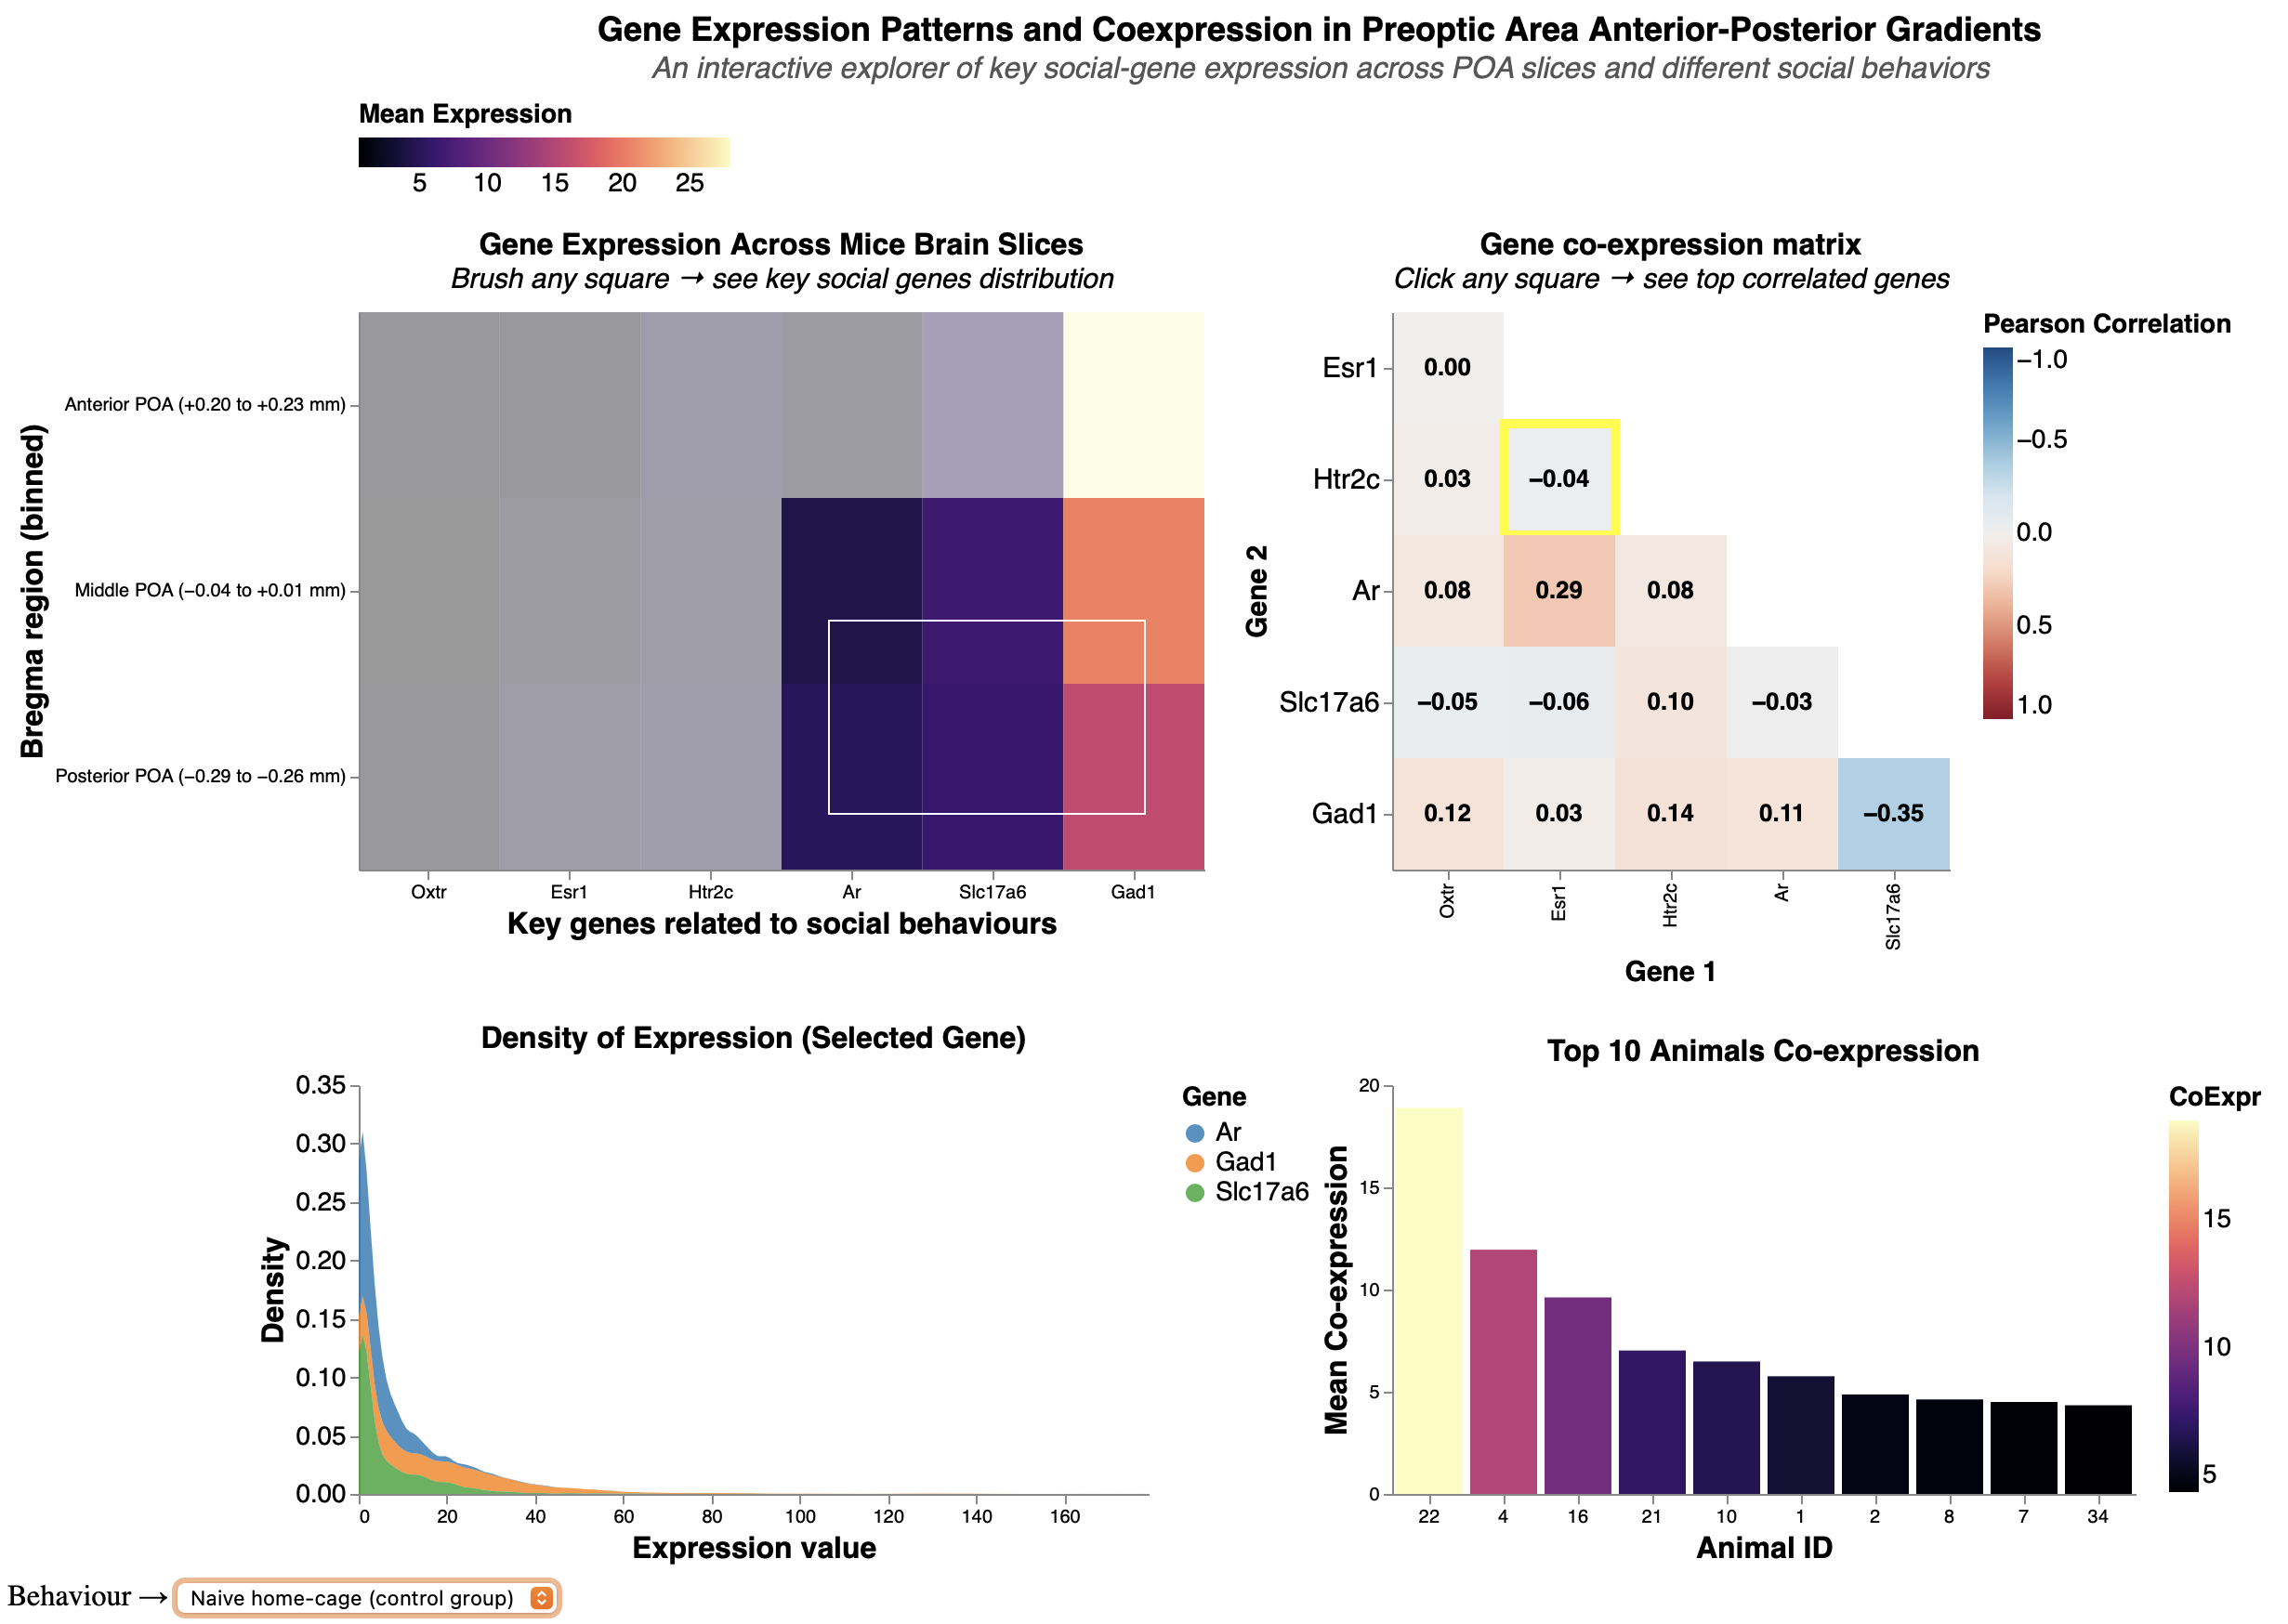
02 – Key Social Gene Expression Patterns
Explores expression of key social genes across anterior, middle, and posterior POA, with interactive co-expression analysis between gene pairs and animal identity details.
Additional Notes
Observes moderate correlation between Ar (testosterone) and Esr1 (estrogen), aiding hypothesis on neuromodulatory signatures as per the paper.
Emily
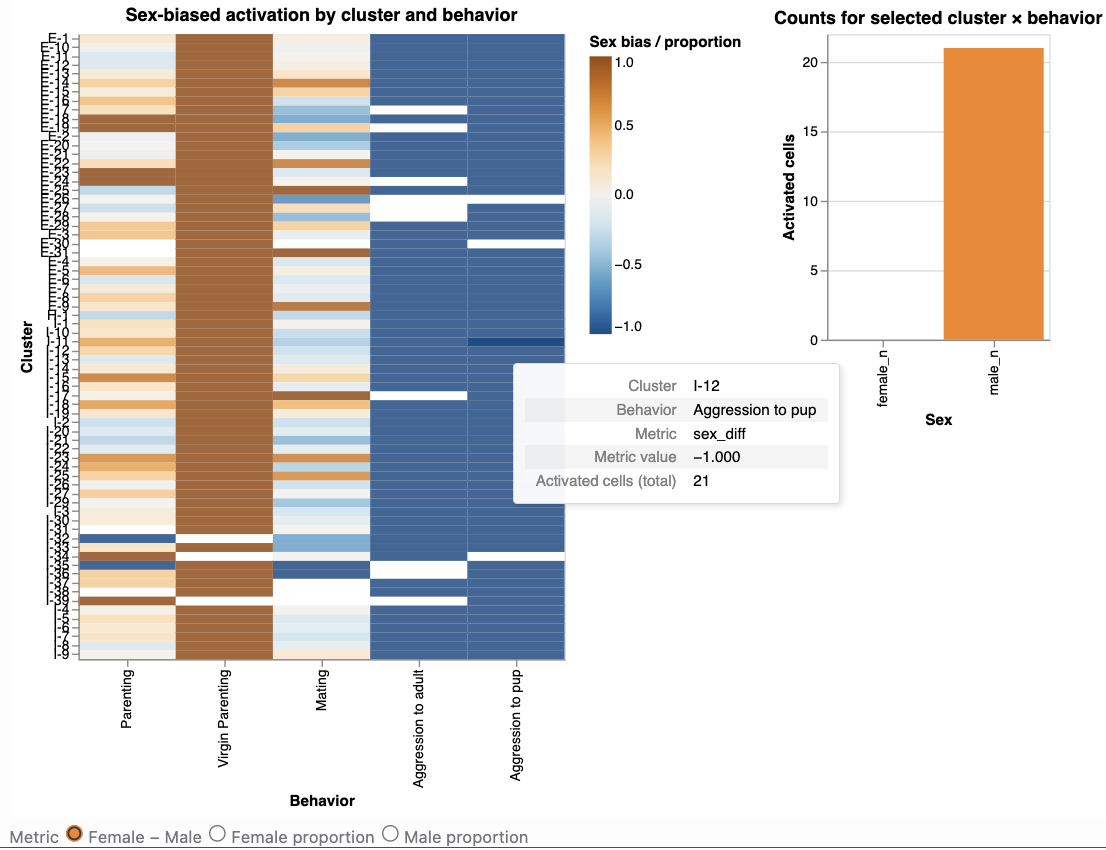
01 – Sex-Biased Cell Activation
Explores sex-biased cell activation (marked by Fos levels) across cell clusters and social behavioral conditions.
Additional Notes
Highlights differential activation in behaviors like parenting and aggression, revealing populations selectively activated in males vs. female mice.
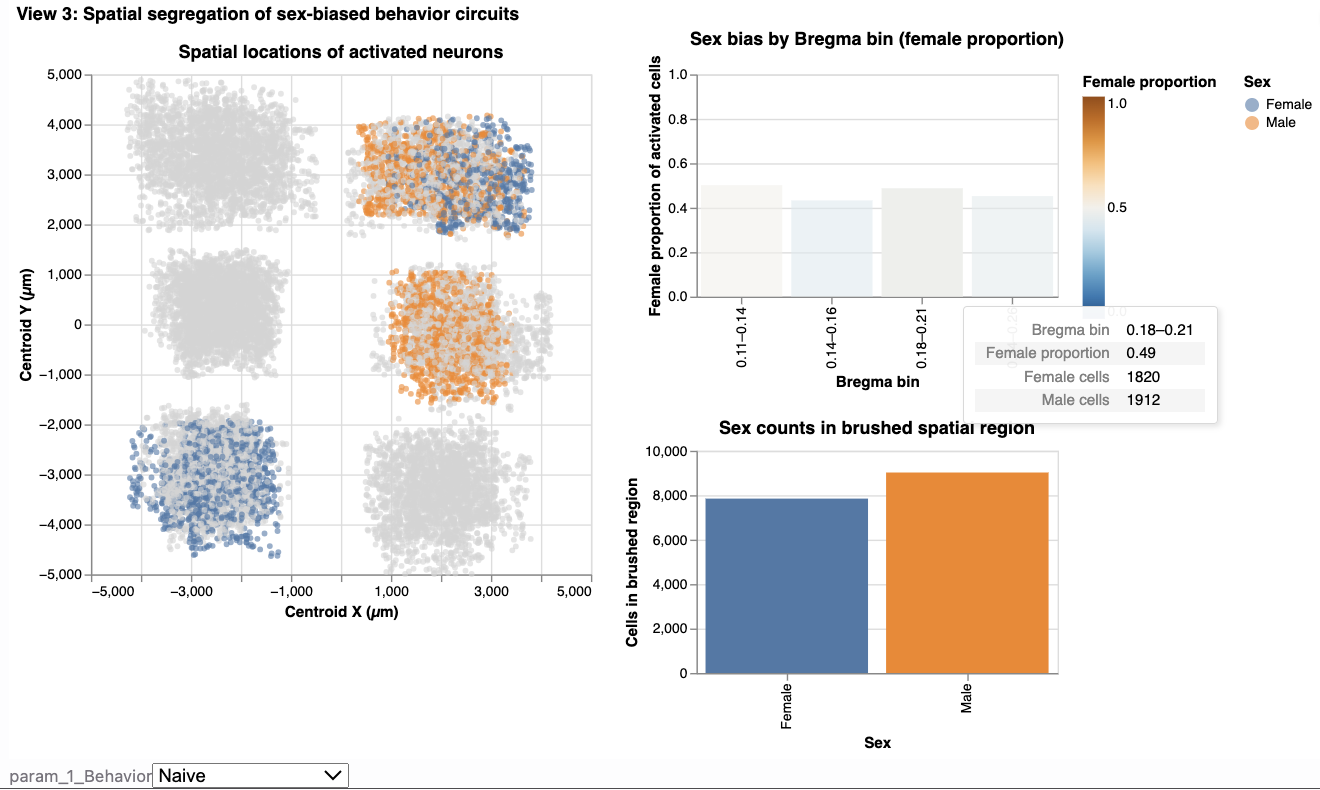
02 – Sexually Dimorphic Cell Distribution
Examines sexually dimorphic patterns in spatial distribution and Bregma position, including interactions with behavioral conditions.
Additional Notes
Shows anterior-posterior variations and sex-behavior interactions, complementing the original authors's spatial mapping neuronal organizations in brain areas like the medial preoptic area (MPOA).
Prateek
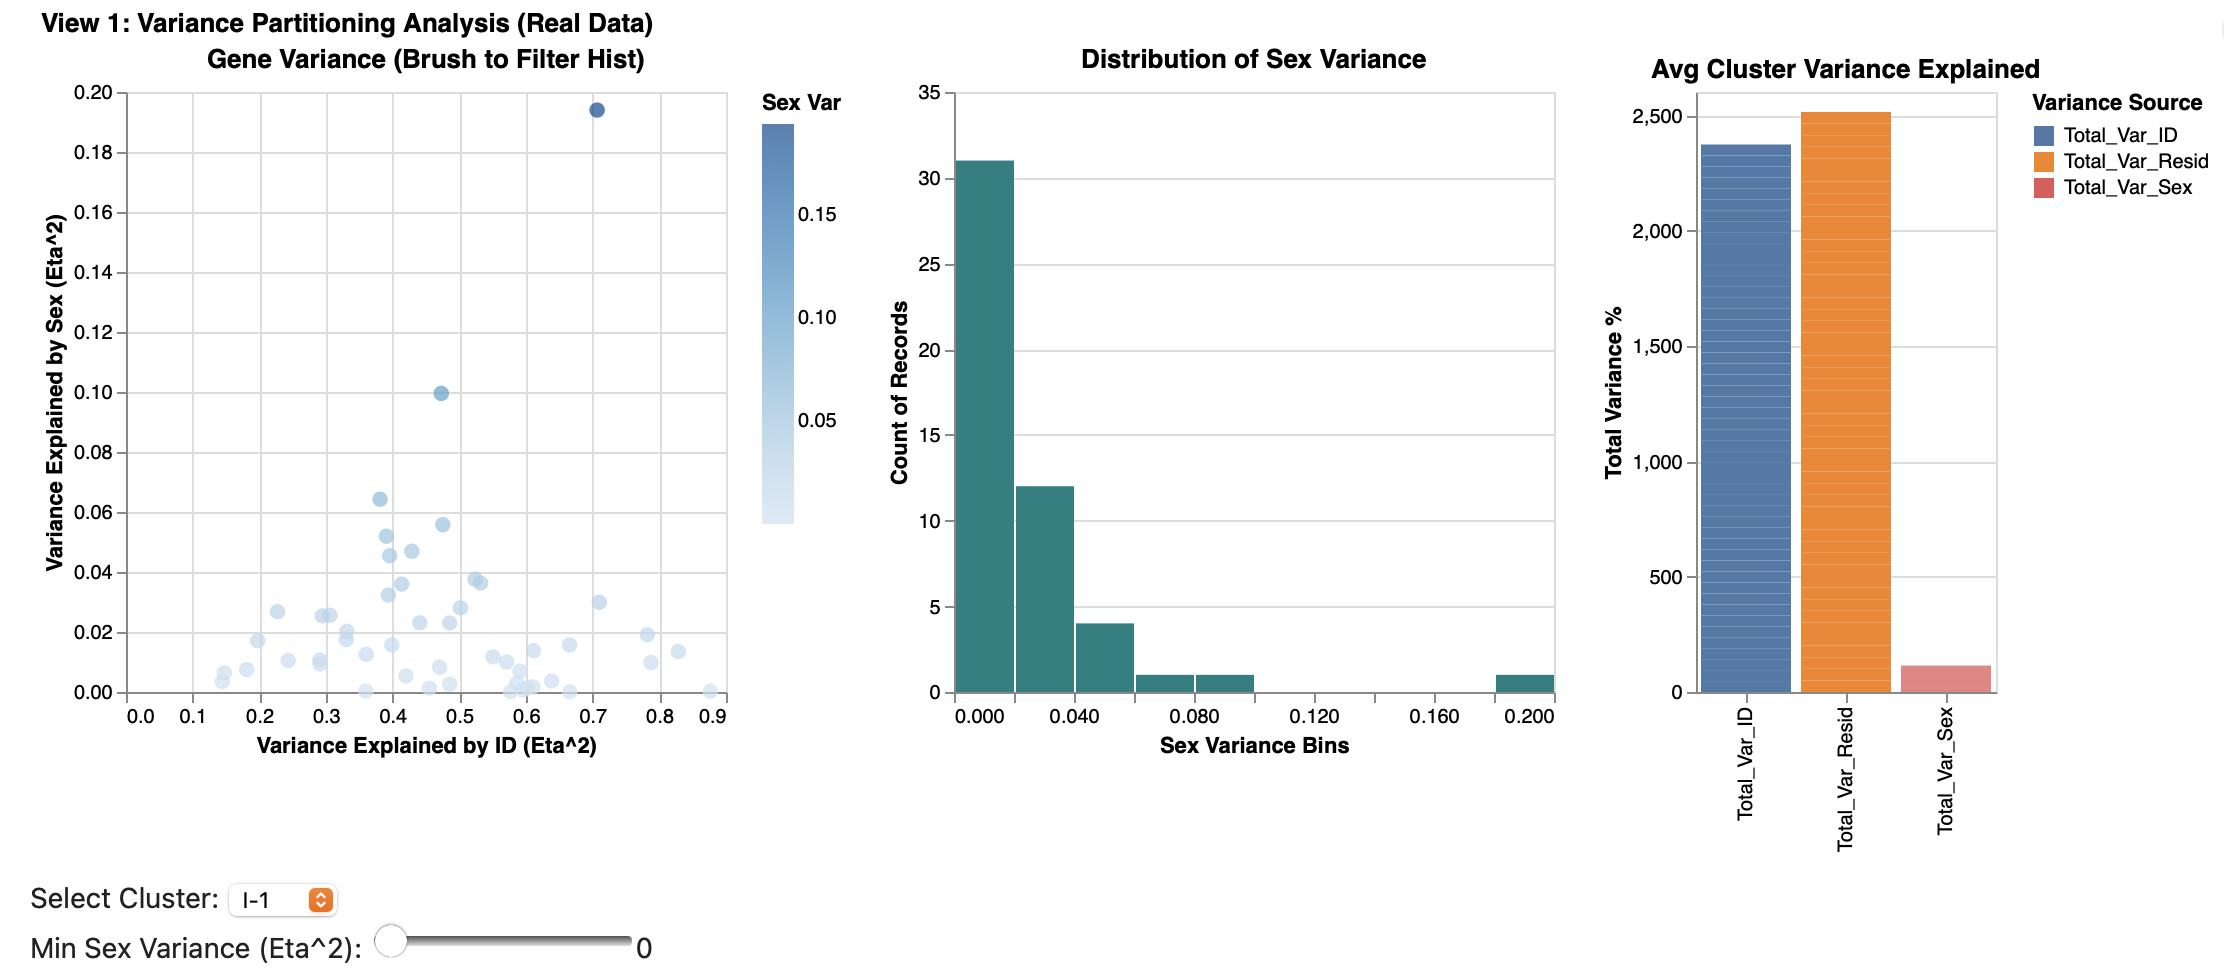
01 – Variance Explained by Sex vs. Individual Mice
Investigates the relationship between variance explained by sex and by individual experimental mice IDs, noting no clear pattern but some outliers suggesting potential positive associations.
Additional Notes
This analysis demands further nuance, aligning with the paper's emphasis on individual variability in neuromodulatory signatures across a subset of ~10,000 profiled cells.
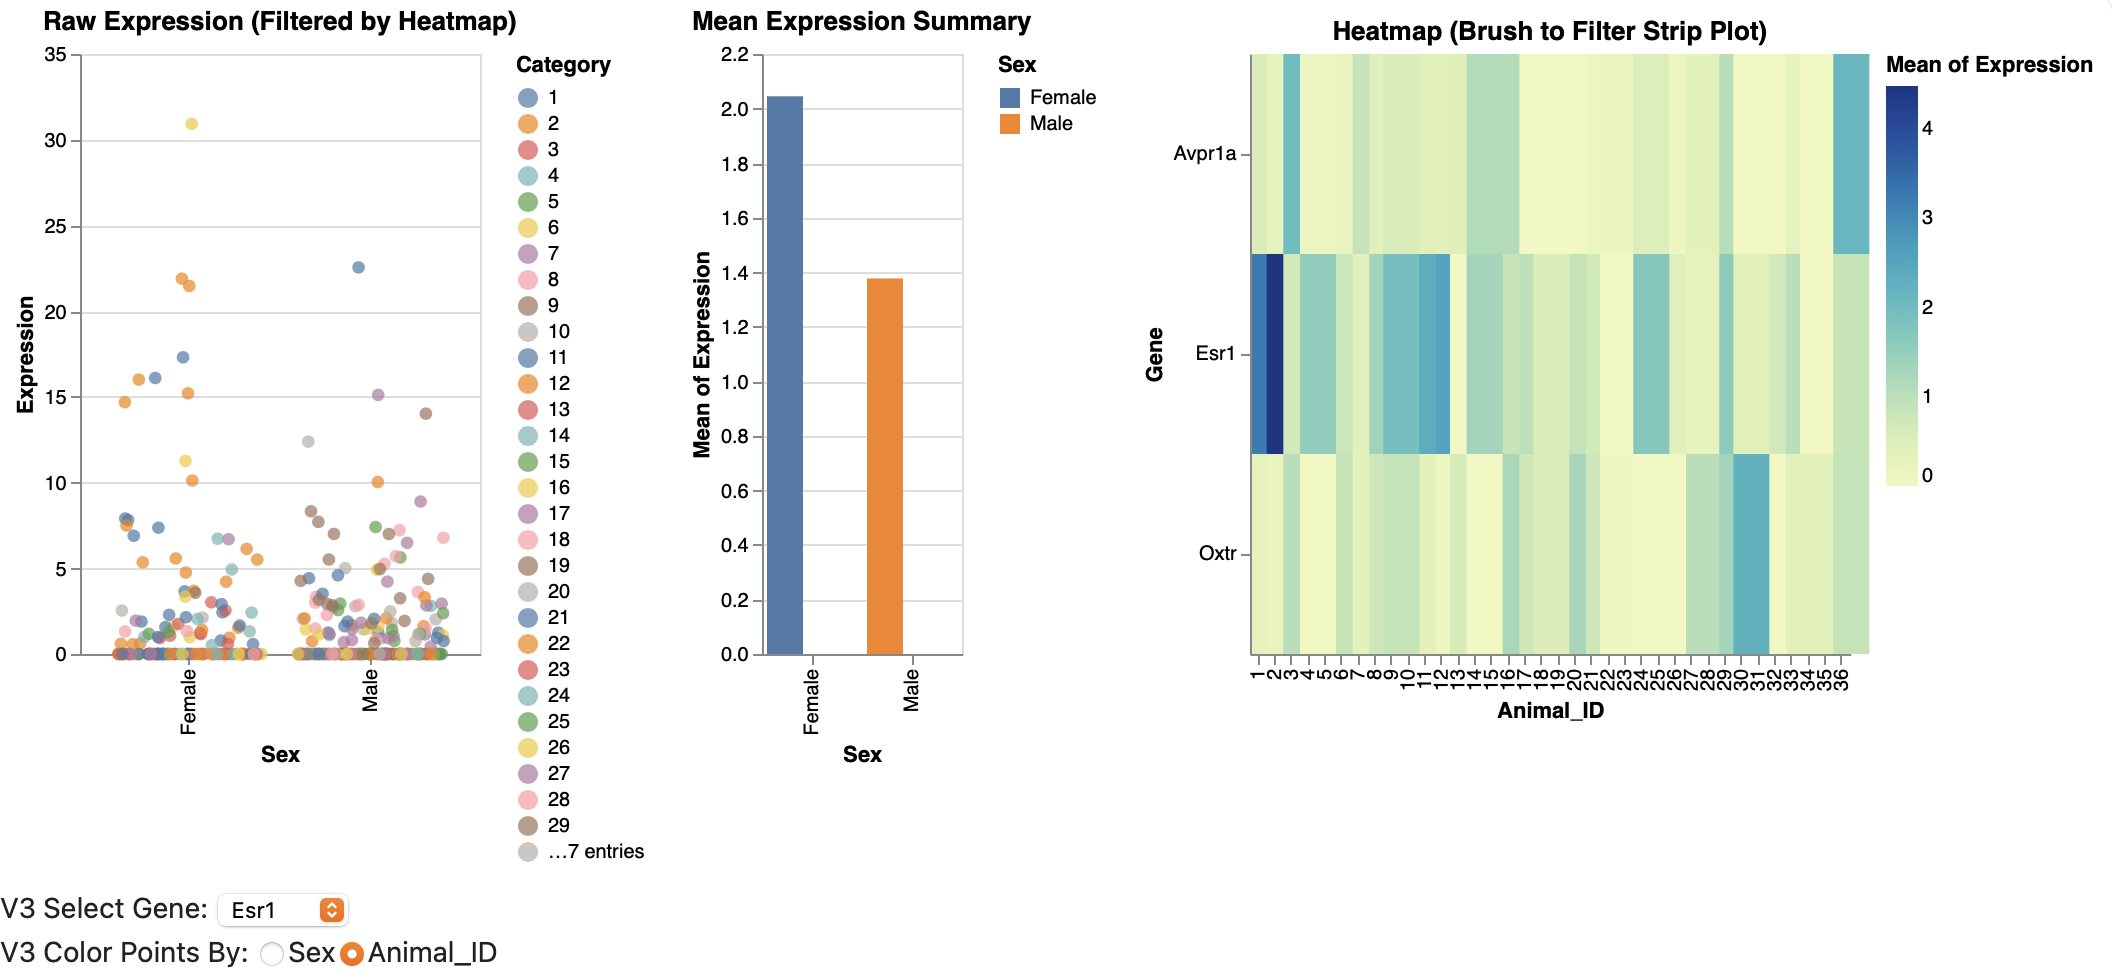
02 – Gene Expression Variability Between Sexes
Analyzes variability in gene expression between sexes, with Esr1 (female-dominated Estrogen gene) showing greater variability in males, and Avpr1a (male-specific Vasopressin gene) higher in males, implying behavioral-genetic interactions.
Additional Notes
Supports the original paper's insights into sex hormone signaling and neuromodulators like Vasopressin (Avp) in social behaviors.
Alina
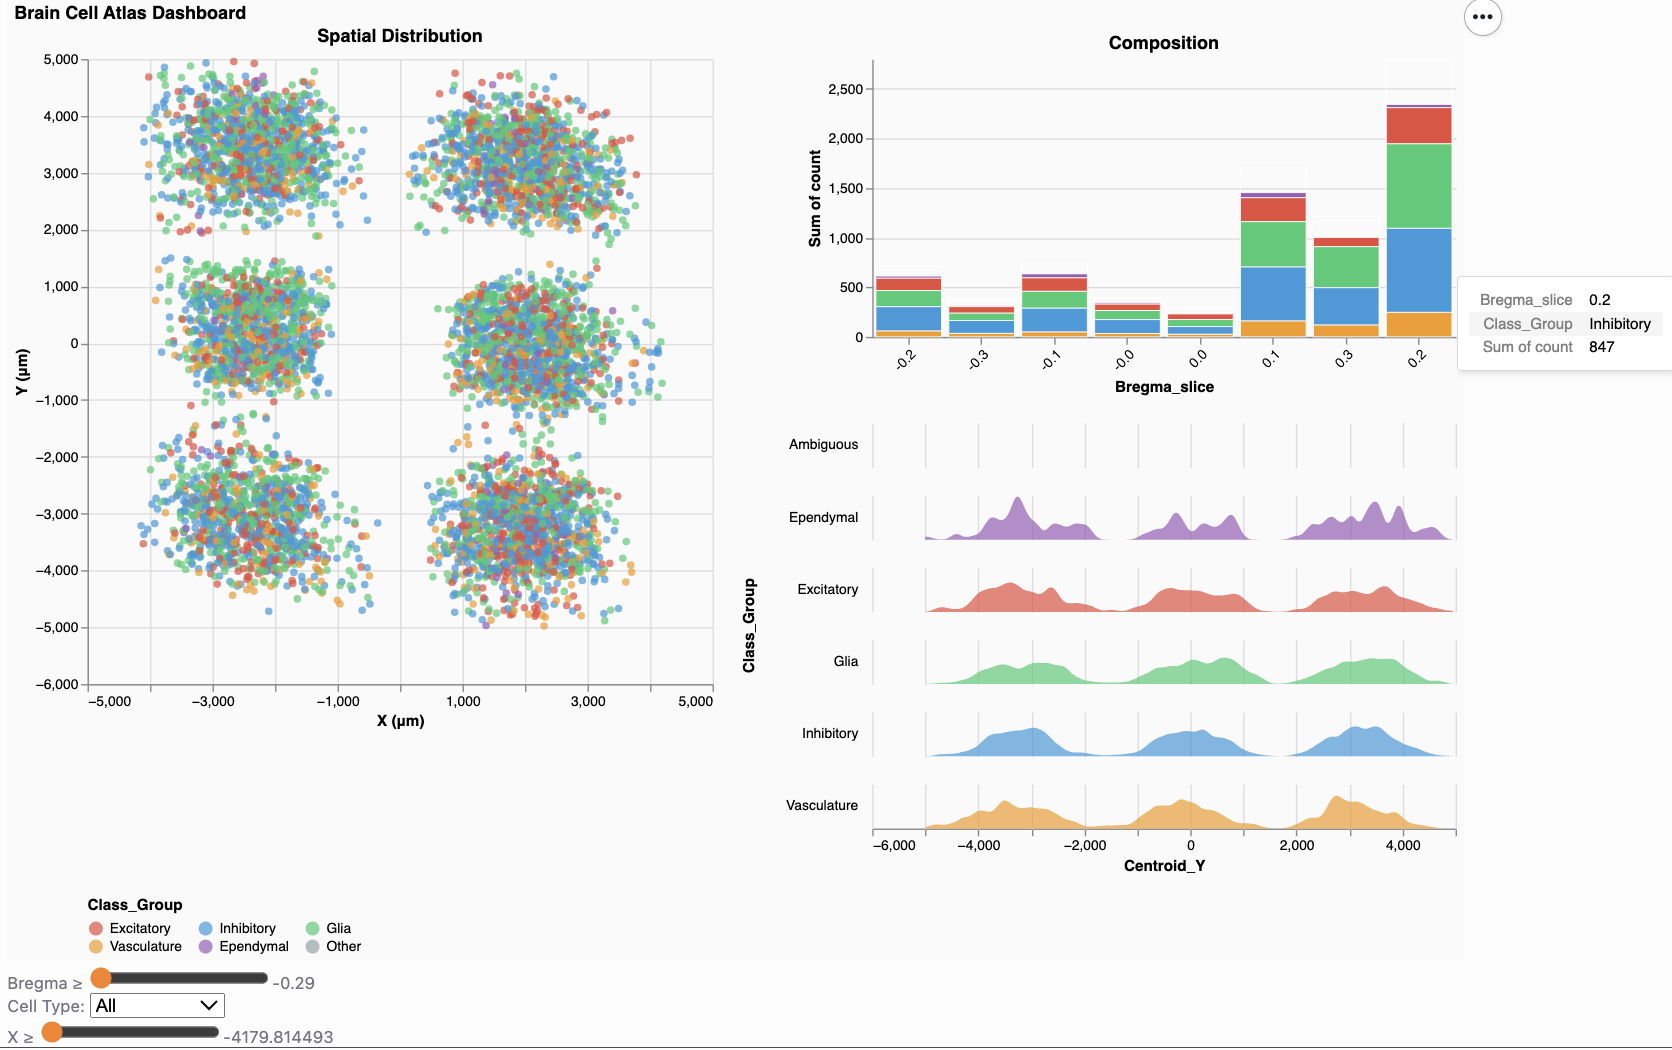
01 – Distribution of Cell Classes
Explores the distribution of cell classes such as excitatory, inhibitory, and regulatory (glial) cells, and vascular cells.
Additional Notes
This dashboard provides an overview of cell class proportions, highlighting the prevalence of inhibitory neurons and excitatory neurons in the POA as identified in the dataset.
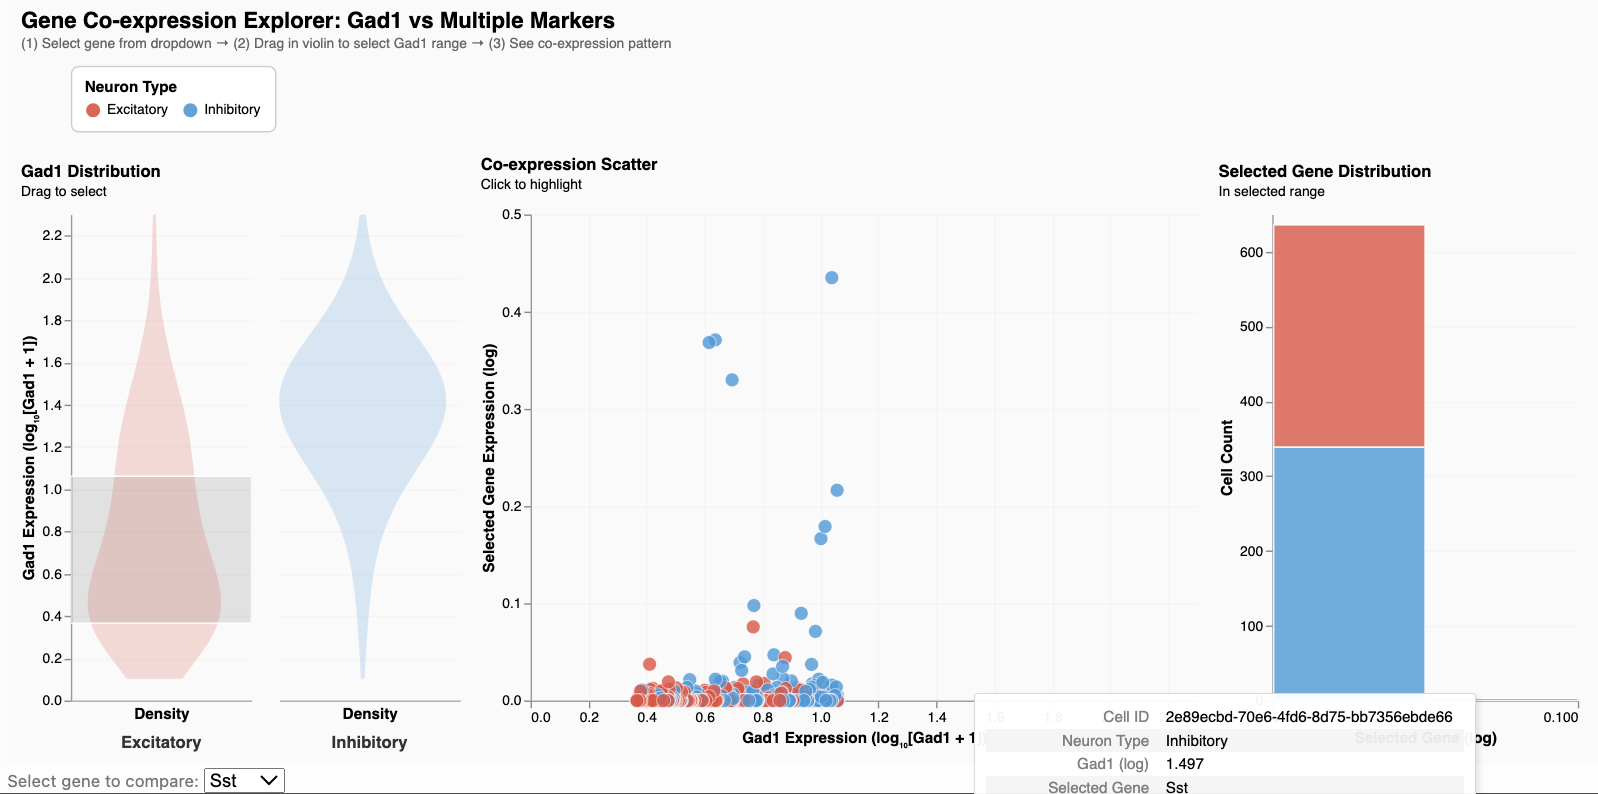
02 – Co-expression of Inhibitory Marker Gad1
Focuses on the co-expression patterns of the inhibitory genetic marker Gad1 with various other genes.
Additional Notes
Visualizes correlations and co-occurrence, noting Gad1's (primary inhibitory-signal gene marker) expression in many excitatory clusters, supporting the original paper's observation of hybrid neurons capable of inhibitory/excitatory signal corelease.